My Fish Oil Experiment
There is a lot of conflicting information about dietary supplements. Do they really make you healthier? Or are they just yet another poorly-justified nutrition fad?
The answer probably depends on the supplement.
Perhaps the most highly touted of which is fish-based omega-3 fatty acids, i.e. “fish oil”. A quick google search reveals just how willing people are to sing its praises:
The health benefits of fish oil include its ability to aid in the treatment of various heart diseases, high cholesterol, depression, anxiety, ADHD, weakened immune system, cancer, diabetes, inflammation, arthritis, IBD, AIDS, Alzheimer’s disease, eye disorders, macular degeneration and ulcers. It also helps aid weight loss, healthy pregnancy, fertility and skin care (particularly for conditions such as psoriasis and acne). [Source]
Indeed, it seems that fish oil is the God supplement: there is no limit to the miraculous effects it’s purported to enjoy.
Excited by the potential gains this supplement could bring, but wary of exaggeration/fad, I tried to take a hard look at the peer-reviewed studies on fish oil supplementation. (I recommend omega-3 wikipedia article as a well-cited, high-level overview of the primary literature.)
Without cherry-picking papers based on desired results, the data is more sobering than the quote above would suggest. In fact, the primary literature is incredibly inconsistent in its findings: papers claiming beneficial effects are very often followed by papers claiming no effect at all.
The state of the literature notwithstanding, large-scale meta-analyses of many studies do show trends. These trends suggest that – for healthy adults – fish oil probably:
Claims of other benefits appear to be too little researched to confirm or deny, and as such don’t constitute justification for taking fish oil as a healthy adult.
With all of the research that has been done on fish oil supplementation, however – with tens of thousands of people and hundreds of studies – one thing can be said with some confidence: it is very low-risk. The National Institute of Heath has a helpful summary of fish oil safety. The typical risks you see are:
- heavy metal poisoning, especially Mercury and PCBs
- prostate cancer [15]
- exacerbated bleeding disorders [16]
Here too, individual studies can be cherry-picked to suggest further risks. But – given the frequency of inconsistent results in the field – these shouldn’t inspire much confidence. What should inspire confidence, however, is the conspicuous absence of any compelling meta-analyses which point to detrimental trends in experimental results. Apart from the link to prostate cancer – which analyzed omega-3 blood concentrations from vitamin E experiments, not fish oil experiments – they don’t appear to exist.
As a healthy person, then, the best reason to take fish oil is that the likelihood of positive outcomes outweighs the risks. There just isn’t much to lose.
At the end of the day, studies are an imperfect guide: you don’t know how your body will respond to any supplement until you actually take it. And in the case of fish oil, the risks seemed very low. So that’s what I decided to do.
I wanted to know whether I – a relatively healthy adult – would exhibit the hallmark benefits observed in some of the studies.
To test this, I used aggregate data from over 10,000 subjects across 20+ studies to design a fish oil supplementation program for myself (under my doctor’s supervision).
I took four 1200mg Trader Joe’s omega-3 fish oil tablets per day (with food) for 4 months.
The results were very positive. I saw:
- a 25% decrease in blood triglycerides (i.e. blood fats)
- a 13% decrease in total cholesterol
- a 5% decrease in LDL cholesterol (i.e. the “bad” cholesterol)
In this post, I talk about the specifics of my experiment: how exactly I did it, why I did it the way I did, what primary research papers justified my decisions, why I chose the Trader Joe’s brand given all the options, and why I may not continue to take this supplement long-term even despite the benefits I’ve seen.
(As a disclaimer: I’m not a doctor. Consult with yours before you try starting any supplementation routine.)
My Self-Experiment
Materials
I took 1200mg omega-3 fatty acid pills sold by Trader Joes. Each pill had the following content, as assessed by an independent testing organization:
| Nutrient | Actual | Label |
|---|---|---|
| Total Omega-3 | 830 mg | – |
| EPA | 520 mg | 400 mg |
| DHA | 230 mg | 200 mg |
| Mercury | 1 ppb | – |
| PCB | 20 ppb | – |
(ppb = part per billion)
Note that the pill content did differ significantly from what was on the label.
Methods
My experiment began before I started taking the pills. For 4 months, I ate a standardized diet and followed a specific exercise routine without taking any supplements. (See supplemental info for details.)
After 4 months, I asked my doctor for a prescription to get my lipid profile taken. Prior to getting my blood drawn, I fasted for 12 hours, abstained from alcohol and dessert for 48 hrs, and went to the lab in the morning before work. This was my t=0, the comparison point for my experiment.
After having my blood drawn, I began taking fish oil supplements. I took 4x of the 1200mg pills per day, adding up to:
| Nutrient | Amount/Day |
|---|---|
| Total Omega-3 | 3.3 g |
| EPA | 2.1 g |
| DHA | 0.9 g |
| Mercury | 1 ppb |
| PCB | 20 ppb |
Consumption was spread out during the course of the day, each time with a meal. Typically I took 1 pill with breakfast and lunch, and 2 with dinner, though this would be modified if I was traveling, forgot a meal, or was eating a low-fat, high-carb meal. As much as possible, I tried to take the pills with the heartiest (high-fat) meals of the day.
The fish oil was kept refrigerated at 37°F.
For more 4 months, I continued the diet and exercise regime above, and supplemented my diet with fish oil as described. I then asked my doctor to get my blood drawn again.
I followed the same pre-blood-test routine of fasting, etc., and scheduled my lab visit before work at the same lab with the same phlebotomist. This was t=1, my experimental trial.
Results
Pre-fish oil supplementation (Table 1):
| t | test | result | status |
|---|---|---|---|
| 0 | total cholesterol | 156 mg/dL | normal |
| 0 | LDL | 95 mg/dL | normal |
| 0 | HDL | 44 mg/dL | normal |
| 0 | triglycerides | 83 mg/dL | normal |
Post-fish oil supplementation (Table 2):
| t | test | result | status |
|---|---|---|---|
| 1 | total cholesterol | 136 mg/dL | normal |
| 1 | LDL | 90 mg/dL | normal |
| 1 | HDL | 34 mg/dL | low |
| 1 | triglycerides | 62 mg/dL | normal |
Change, t=0 to t=1 (Table 3):
| test | change | expected | healthy |
|---|---|---|---|
| total cholesterol | -12.8% | no | yes |
| LDL | -5.2% | no | yes |
| HDL | -22.7% | no | no |
| triglycerides | -25.3% | yes | yes |
Discussion
The point of this self-experiment was to see if my body displayed the hallmark positive effects of fish-oil supplementation. It did, in spades.
Arguably, the most robust positive effect of fish oil supplementation is a significant (~30%) reduction in blood triglycerides. This has been reproduced in dozens of studies – helpfully reviewed in [1], [2], and [3]. Here’s an excerpt:
The hypotriglyceridemic effects of omega-3 fatty acids from fish oils are well established. [. . .] ~4 g/d of omega-3 fatty acids from fish oil decreased serum triglyceride concentrations by 25% to 30%, with accompanying increases in LDL cholesterol of 5% to 10% and in HDL cholesterol of 1% to 3%. [Source]
Triglycerides are blood fats distinct from cholesterol, produced by the body from excess calories. Intuitively, having less fat in your blood sounds good: less clogged arteries! But, intuitions aside, one study [4], found that there is a direct relationship between levels of these fats and heart disease (i.e. the more triglycerides you have, the more likely you are to die of heart disease). To quote:
We studied the association between plasma triglyceride levels and the 12-year incidence of death from coronary heart disease[.] [. . .] The rates of coronary death in both men and women increased with the triglyceride level.
The 25% decrease in my triglyceride levels (which were already quite good) was everything the studies had made me hopeful of. This, coupled with the fact that heart disease is the leading cause of death in the United States per the CDC, is a compelling reason for me to continue taking fish oil.
As encouraging as these results were, I was taking a fairly large amount of fish oil: 4x as much as the bottle recommended. Why?
I did this because I wanted to reproduce, as closely as possible, the studies that had observed such marked changes in triglyceride levels. One such study was quoted above. Another study [5] noted:
Intakes of 2.0 to 4.0 g/day of long-chain omega-3 fatty acids are generally required to achieve significant (>15%) TG-lowering [triglyceride-lowering] effects. As noted by Pirillo and Catapano, there is little evidence of clinically relevant efficacy at dosages <1 g/day. [Full Text]
The following figure, Fig 1 from a 2006 systematic review of the fish oil literature [2], was also key in my decision:
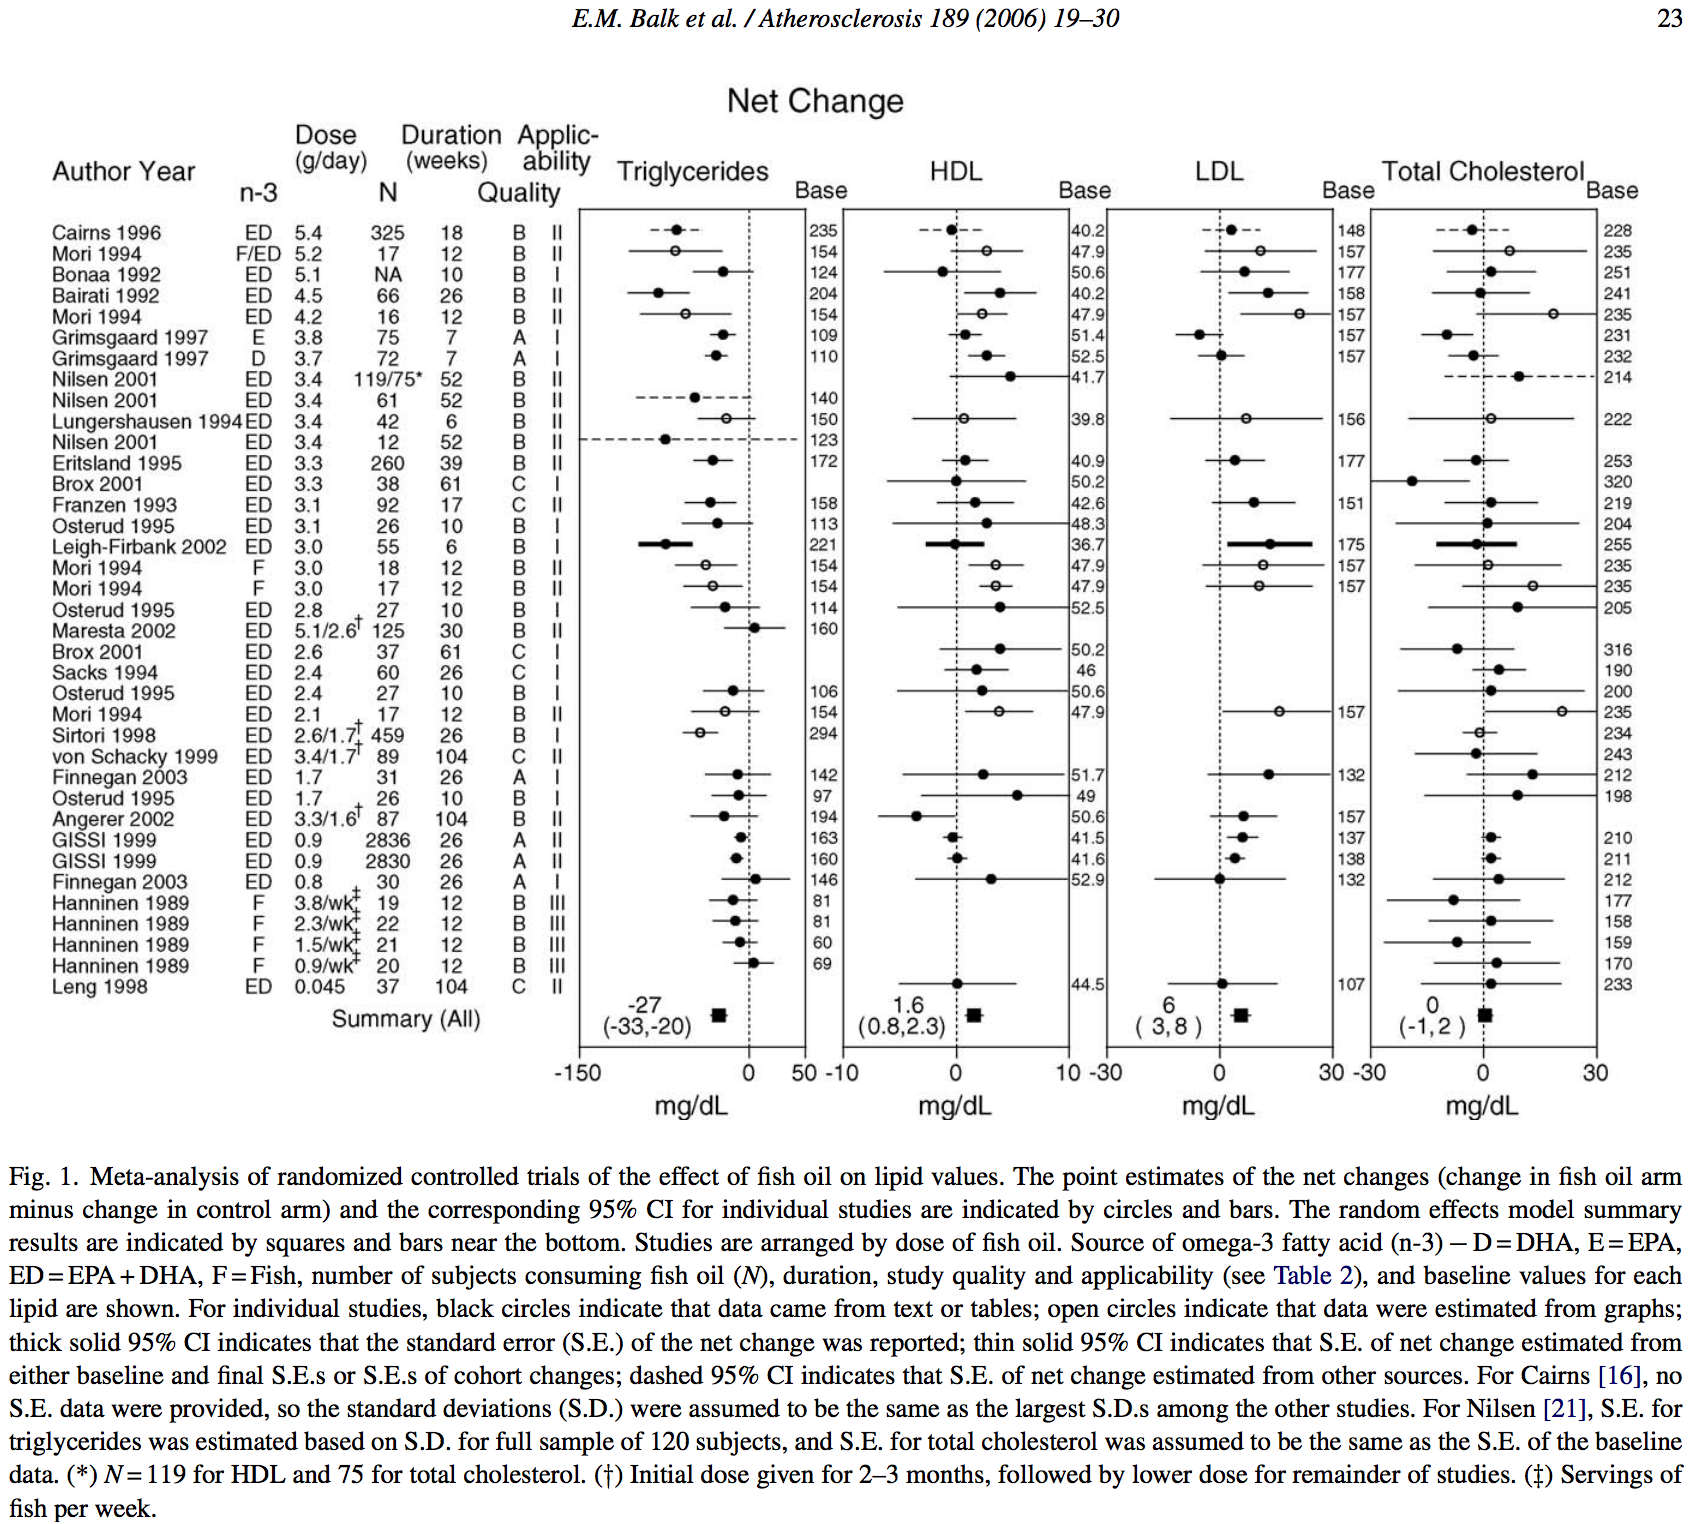
From figure 1, “Net Change”, you can see the actual dosages of fish oil per study reviewed. The average dosage (excluding studies that monitored dietary fish consumption), was 3.06g of EPA+DHA per day.
EPA and DHA are two kinds of omega-3 fatty acids, and the primary constituents of omega-3 found in fish-oil. EPA is short for eicosapentaenoic acid, and DHA docosahexaenoic acid. They seem to be universally assumed the important parts of fish oil, though I have been unable to find a study which explains why.
By taking 4 of the Trader Joe’s fish oil pills each day, I was able to very closely reproduce the EPA+DHA consumption in the triglyceride-lowering clinical trials. This, again, was the nutrient breakdown of my dosage:
| Nutrient | Amount/Day |
|---|---|
| Total Omega-3 | 3.3 g |
| EPA | 2.1 g |
| DHA | 0.9 g |
| Mercury | 1 ppb* |
| PCB | 20 ppb* |
* = calculation not effected by volume consumed
My total EPA+DHA content at this dose was 3.0g, very close to the 3.06g average seen in the trials. I also liked this dosage because the EPA:DHA ratio was almost exactly 2:1, the ratio that seems universally agreed upon to be ideal. (Though, I’ve been unable to track down any study which justifies this ratio. I created a question in the health stack exchange to try to see if anyone else knows.)
Moreover, this dose kept my intake of Mercury, PCB, and other harmful compounds to a minimum. To quote from the results of the independent testing organization mentioned above, Trader Joes’ supplement had:
Mercury content measured at 1 PPB [. . .] significantly below the Global Organization for EPA and DHA Omega-3 (GOED) 100 PPB limit.
Bulk samples of this product also passed the six mineral assays, indicating presence of under 1 PPM of arsenic, lead, cadmium, bismuth, antimony, and silver compounds.
Total polychlorinated biphenyl (PCB) content [. . .] measured at 0.02 PPM, which is significantly below the Food and Drug Administration’s (FDA) 2 PPM limit for the edible parts of fish/shellfish. It is also below the stricter standards enacted by California’s Proposition 65, which requires products containing greater than 0.09 PPM of PCB content to bear a cancer warning.
Even at my higher dose, I still came in well below the 100 PPB mercury limit. To put this in perspective, a typical can of light tuna contains on average 126 PPB of mercury – according to the FDA. So this dose is roughly equivalent (with respect to Mercury content) to eating less than one can of light tuna per month.
My daily PCB exposure, however, would seem to be fairly close to the CA proposition 65 limit (90 ppb). That limit was determined in 1989 based on data from 1987. The California Office of Environmental Health Hazard Assessment (OEHHA), which is responsible for implementing proposition 65, issued a proposed amendment in 2012 which suggested that this limit should be revised in light of more recent findings. That amendment says:
In 1989, an NSRL [no significant risk limit] for PCBs of 0.09 micrograms (µg) per day was derived and adopted in Section 25705(c). It was based on a cancer potency value of 7.7 milligrams, per kilogram bodyweight per day (mg/kg-day) published in a list of cancer potency values in the U.S. EPA 1987 report “Health Assessment Document for Beryllium.” This U.S. EPA cancer potency value has been superseded by values published by the U.S. EPA in 1996 in its document “PCBs: Cancer Dose Response Assessment and Application to Environmental Mixtures.”
They then go on to calculate a new “no significant risk limit” based on the updated studies:
The NSRL can be calculated from the U.S. EPA slope factor, a measure of the carcinogenic activity of PCBs, as follows. [. . .] Inserting this number into the equation above results in an NSRL of 0.35 µg/day for food chain exposures.
Note that ppb is a rate. It stands for “parts per billion”, and is equivalent to µg/L.
Taking more pills doesn’t change the rate, though it does increase the volume
consumed. Obviously, the pill volume is exceedingly low.
This site provides
volumetric data on gel capsules based on size. The Trader Joe’s capsules are
2.5cm x 1cm x 1cm, which in the site above corresponds to an estimated volume
of 1.37 mL each. We can can then estimate the total daily PCB consumption as
follows:
1.37mL/pill x 4 pills = ~5.5mL
5.5 mL pill volume = 0.0055 L pill volume
20 ppb pill PCB = 20 µg PCB/L pill
20 µg PCB/L pill x 0.005 L pill volume = 0.1 µg PCB in 4 pills
So, my dosage contained roughly 0.1 µg of PCB, less than 30% of the updated no significant risk limit.
I did not experience a fishy aftertaste when taking these pills either, unless I took 3 or more at once.
For anyone interested in what other factors went into choosing Trader Joes’ supplement, I created a google sheet with all of the qualities I was interested in (including cost) and then color-coded each cell to create a heatmap of the supplement brands.
The “Net Change” figure also explains why I chose to run my experiment for 4 months (~17 weeks). As seen there, the studies ranged in duration from 6 weeks to 104, averaging 28 weeks. An experimental trial of 17 weeks put me squarely in the clinical range.
I chose to take my supplements with high-fat meals because this has been shown to aid in absorption:
Human trials have demonstrated that EE [ethyl ester] omega-3s require consumption with a high fat meal to secrete pancreatic lipase and thereby enhance bioavailability. [6]
Also, from the 2015 “National Lipid Association Recommendations for Patient-Centered Management of Dyslipidemia” [7], [full text]:
EPA and DHA ethyl esters may not be absorbed well on an empty stomach or when consumed with a low-fat meal.
I actually had trouble finding the primary source research for these claims. [7] cites [8] as evidence, but [8] cites [9] – titled “A Randomized, Open-label, Four-Way Crossover Study to Compare the Relative Bioavailability of a Single Dose of Epanova With Lovaza After a Low-Fat and High-Fat Meal”.
Unfortunately [9] doesn’t actually provide any of the results from the high-fat trials:
Results for the analyses of the High-Fat Periods were not posted because the critical comparison was the response of Lovaza versus Epanova to the clinically relevant low-fat diet to be used as adjunct in hypertriglyceridemia.
So I sent an email to the author of these papers to try to get these results. I will update this post if I ever hear back.
One reason why I wanted to perform these tests was that not everyone’s body responds to drugs in the same way. I had no idea how my body was going to react. It was also important to test because I have relatively high LDL cholesterol and relatively low HDL cholesterol (tables 1, 2), and one fairly robust effect of fish oil supplementation is an increase in both. (See [1], [2]).
Fortunately, my LDL actually slightly decreased, contrary to expectations, while my HDL also went down – which was not expected, and not good. I guess this is why you test these things!
I suspect that my HDL may have decreased because during the latter half of the experiment I changed the type of aerobic exercise I was getting (from running to biking/elliptical) because of a back injury. I also probably got a bit more vigorous cardio exercise in the first half of the experiment than the last half because I was training for a 5k run (i.e. I was running for ~22min instead of 15min).
As mentioned in the 2015 “National Lipid Association Recommendations for Patient-Centered Management of Dyslipidemia” [7]:
Exercise training in the absence of a change in adiposity has effects to reduce the circulating TG concentration and modestly raise the level of HDL-C. [. . .] The amount of aerobic exercise needed to produce significant HDL-C changes is estimated at ∼1000 to 1500 kcal/week (i.e., ∼7 to 14 miles/week of walking or jogging).
Now that my back has improved, I plan to resume running, while increasing my amount of aerobic exercise to 25 min (~7miles/week), and I will continue taking the fish oil supplements as described. I’ll retest in a few months to see if my HDL has improved. If not, that might mean game-over for fish oil and me.
I’m also considering trying a similar experiment with krill oil at a lower concentration. A limited trial of 60 people (excluding 60 others used in controls) showed a 44% increase in HDL following 1g supplementation of krill oil and a 32% reduction in LDL, and an 11% reduction in triglycerides [10]. Other studies have similarly found that krill oil has a more potent effect than traditional fish-oil supplements, most notably [11].
Supplemental Information
For exercise, my routine was:
- At least 2 workouts per week, not more than 3
- 15 min of vigorous cardio exercise per workout (heart rate >= 170 BPM) via running, bike, or elliptical
- 3 weight training exercises per workout, 3 sets each of 10 reps at roughly 80% of my personal max
My diet was essentially a low carb diet (as low as I could stand):
- low net-carb meals whenever possible, but not always
- no food between meals unless it was very low net-carb
- no dessert 4 days per week, where “dessert” was roughly defined as any sweet (i.e. non-savory) food with added sugar that was not part of a meal
- stevia was okay as a sugar substitute between meals
- little to no milk products: milk, butter, yogurt, cream; dairy was substituted with low-cholesterol products like coconut oil/milk/cream whenever possible
- protein was largely from chicken and turkey, little red meat, no fish
- cooking oil was usually olive oil, but sometimes coconut oil
To those who would object that my diet and/or exercise weren’t ideal: you’re probably right. I didn’t intend them to be. The point was just to create a rough set of rules to keep my diet and exercise consistent throughout the experiment. By keeping them consistent, it allowed me to reasonably infer that changes in my blood tests weren’t due to diet or exercise.